

Graph information
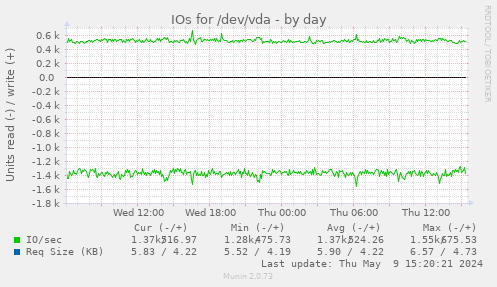
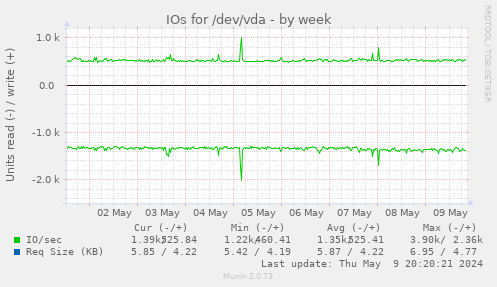
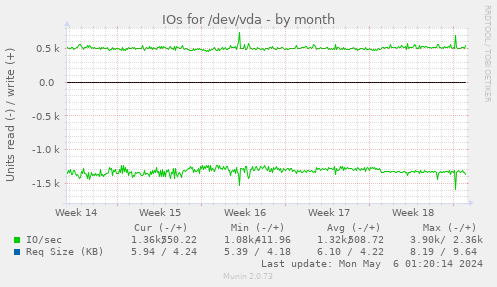
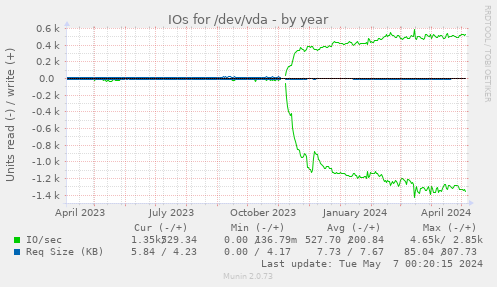
This graph shows the number of IO operations pr second and the average size of these requests. Lots of small requests should result in in lower throughput (separate graph) and higher service time (separate graph). Please note that starting with munin-node 2.0 the divisor for K is 1000 instead of 1024 which it was prior to 2.0 beta 3. This is because the base for this graph is 1000 not 1024.
| Field | Internal name | Type | Warning | Critical | Info |
|---|---|---|---|---|---|
| IO/sec | wrio | gauge | |||
| Req Size (KB) | avgwrrqsz | gauge | Average Request Size in kilobytes (1000 based) |